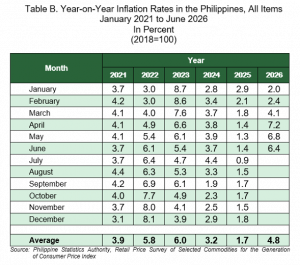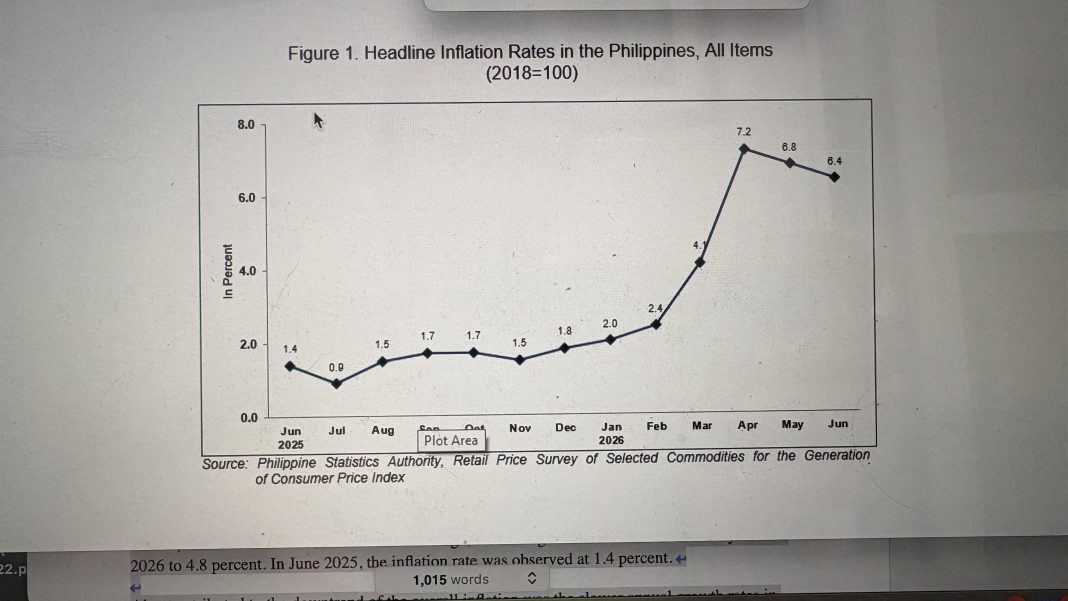
The Philippines’ headline or overall inflation, which measures the pace of growth in prices of goods and services over time, eased to 6.4 percent in June 2026 from 6.8 percent in May 2026, primarily due to the slowed down in the transport index to 12.8 percent from 16.2 percent the previous month, the Philippine Statistics Authority (PSA) reported.
Undersecretary Claire Dennis S. Mapa, National Statistician and Civil Registrar General of the PSA, said the slower June inflation brought the average inflation rate from January to June 2026 to 4.8 percent. In June 2025, the inflation rate was observed at 1.4 percent.
Also contributed to the downtrend of the overall inflation was the slower annual growth rates in the indices of food and non-alcoholic beverages at 5.2 percent in June 2026 from 5.7 percent in May 2026, and furnishings, household equipment and routine household maintenance at 3.7 percent in June 2026 from 3.9 percent in the previous month.
He said that while the transport inflation slowed down in June, it is still at risk due to volatile external factors.
On the other hand, faster annual increases were observed in the indices of the following commodity groups during the month:
a. Alcoholic beverages and tobacco, 5.9 percent from 5.4 percent;
b. Clothing and footwear, 3.1 percent from 3.0 percent;
c. Housing, water, electricity, gas and other fuels, 8.0 percent from 7.8 percent;
d. Health, 4.6 percent from 4.1 percent;
e. Information and communication, 1.0 percent from 0.9 percent;
f. Education services, 3.9 percent from 2.9 percent;
g. Restaurants and accommodation services, 7.0 percent from 6.7 percent; and
h. Personal care, and miscellaneous goods and services, 3.7 percent from 3.4 percent.
The indices of the rest of the commodity groups remained at their previous month’s annual rates.
The top three commodity groups contributing to the June 2026 overall inflation rate were the following:
a. Food and non-alcoholic beverages with 31.4 percent share or 2.0 percentage points;
b. Housing, water, electricity, gas and other fuels with 26.0 percent share or 1.7 percentage points; and
c. Transport with 18.4 percent share or 1.2 percentage points.
Food inflation
Food inflation at the national level recorded a slower annual increase of 5.4 percent in June 2026 from 5.8 percent in the previous month. In June 2025, food inflation was lower at 0.1 percent.
The downtrend in the food inflation in June 2026 was mainly driven by the faster year-on-year decrease in the index of meat and other parts of slaughtered land animals at 4.2 percent during the month from 2.5 percent in May 2026. Also contributed to the lower food inflation were the slower annual increases in the indices of fish and other seafood at 7.8 percent during the month from 8.8 percent in May 2026, and rice at 15.0 percent in June 2026 from 15.6 percent in the previous month.
In addition, slower annual increments were noted in the indices of corn at 24.5 percent during the month from 25.5 percent in May 2026, and oils and fats at 7.9 percent in June 2026 from 8.5 percent in the previous month.
Moreover, faster year-on-year decreases were observed in the indices of milk, other dairy products and eggs at 0.3 percent in June 2026 from 0.2 percent previous month, and sugar, confectionery and desserts at 0.5 percent in June 2026 from 0.4 percent in the previous month.
On the contrary, higher annual increases were observed in the indices of the following food items in June 2026:
a. Flour, bread and other bakery products, pasta products, and other cereals, 3.9 percent from 3.5 percent;
b. Vegetables, tubers, plantains, cooking bananas and pulses, 9.0 percent from 6.2 percent; and
c. Ready-made food and other food products not elsewhere classified, 2.7 percent from 2.4 percent.
The annual increase in the index for fruits and nuts remained at 4.9 percent during the month.
Food inflation shared 29.6 percent or 1.9 percentage points to the overall inflation in June 2026.
The top three food groups in terms of contribution to the food inflation during the month were the following:
a. Cereals and cereal products, which include rice, corn, flour, bread and other bakery products, pasta products, and other cereals, with 68.4 percent share or 3.7 percentage points;
b. Fish and other seafood with a share of 25.1 percent or 1.4 percentage points; and
c. Vegetables, tubers, plantains, cooking bananas and pulses with a share of 14.6 percent or 0.8 percentage point.
National Capital Region
Similar to the trend at the national level, inflation rate in the National Capital Region (NCR) moved at a slower pace of 4.9 percent in June 2026 from 5.0 percent in the previous month. In June 2025, inflation rate in the area was recorded at 2.6 percent.
The lower inflation rate in NCR was mainly influenced by the slower annual increase in the transport index at 8.0 percent in June 2026 from 11.4 percent in the previous month. Also contributed to the downtrend were the slower annual increases observed in the indices of food and non-alcoholic beverages at 2.2 percent in June 2026 from 2.5 percent in May 2026, and information and communication at 0.5 percent during the month from 0.6 percent in May 2026.
Areas Outside NCR (AONCR)
Following the trend at the national level and in NCR, the overall inflation in AONCR decelerated to 6.7 percent in June 2026 from 7.1 percent in May 2026. Inflation rate in the area was recorded at 1.1 percent in June 2025.
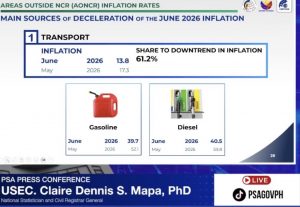
The deceleration of inflation in the area was primarily contributed by the slower annual increment in the transport index at 13.8 percent during the month from 17.3 percent in May 2026. Also contributed to the downtrend of the overall inflation in AONCR were the lower annual growth rates in the indices of food and non-alcoholic beverages at 5.8 percent in June 2026 from 6.3 percent in the previous month, and furnishings, household equipment and routine household maintenance at 3.8 percent during the month from 4.0 percent in May 2026.